The investment environment seems exceptionally precarious, given continuing weak energy prices, intensifying geopolitical drama and ongoing regulatory reform. But don’t tell that to financial advisors in the Canadian retail investment business, who appear to be enjoying great success despite all the negative news.
The results of Investment Executive‘s (IE) 2016 Report Card series found that advisors are growing their assets under management (AUM) and enjoying strong productivity and rising compensation. All of these positive trends are flying in the face of a macroeconomic environment is signalling a need for caution.
In Canada, household debt remains elevated and the real estate market seems dangerously inflated. Energy prices are weighing on economic growth in certain parts of the country, and provincial deficits are rising in response.
And much of the rest of the world doesn’t look much healthier. From the surge in populist sentiment (evident in both the U.S. and Europe) that may endanger global trade and rising threats of civil unrest in numerous regions to increasingly tenuous prospects for emerging markets – these factors are leading to a particularly precarious investment climate these days.
Yet, to hear Canada’s advisors describe their individual businesses, none of these global issues are putting much of a crimp in their success. The average advisor surveyed for this year’s Report Card series reported growth in both top-line and bottom-line metrics. For the average advisor, AUM was up while client numbers were down, which points to rising productivity (as measured by AUM/client household). And, on the bottom line, compensation for the average advisor also rose.
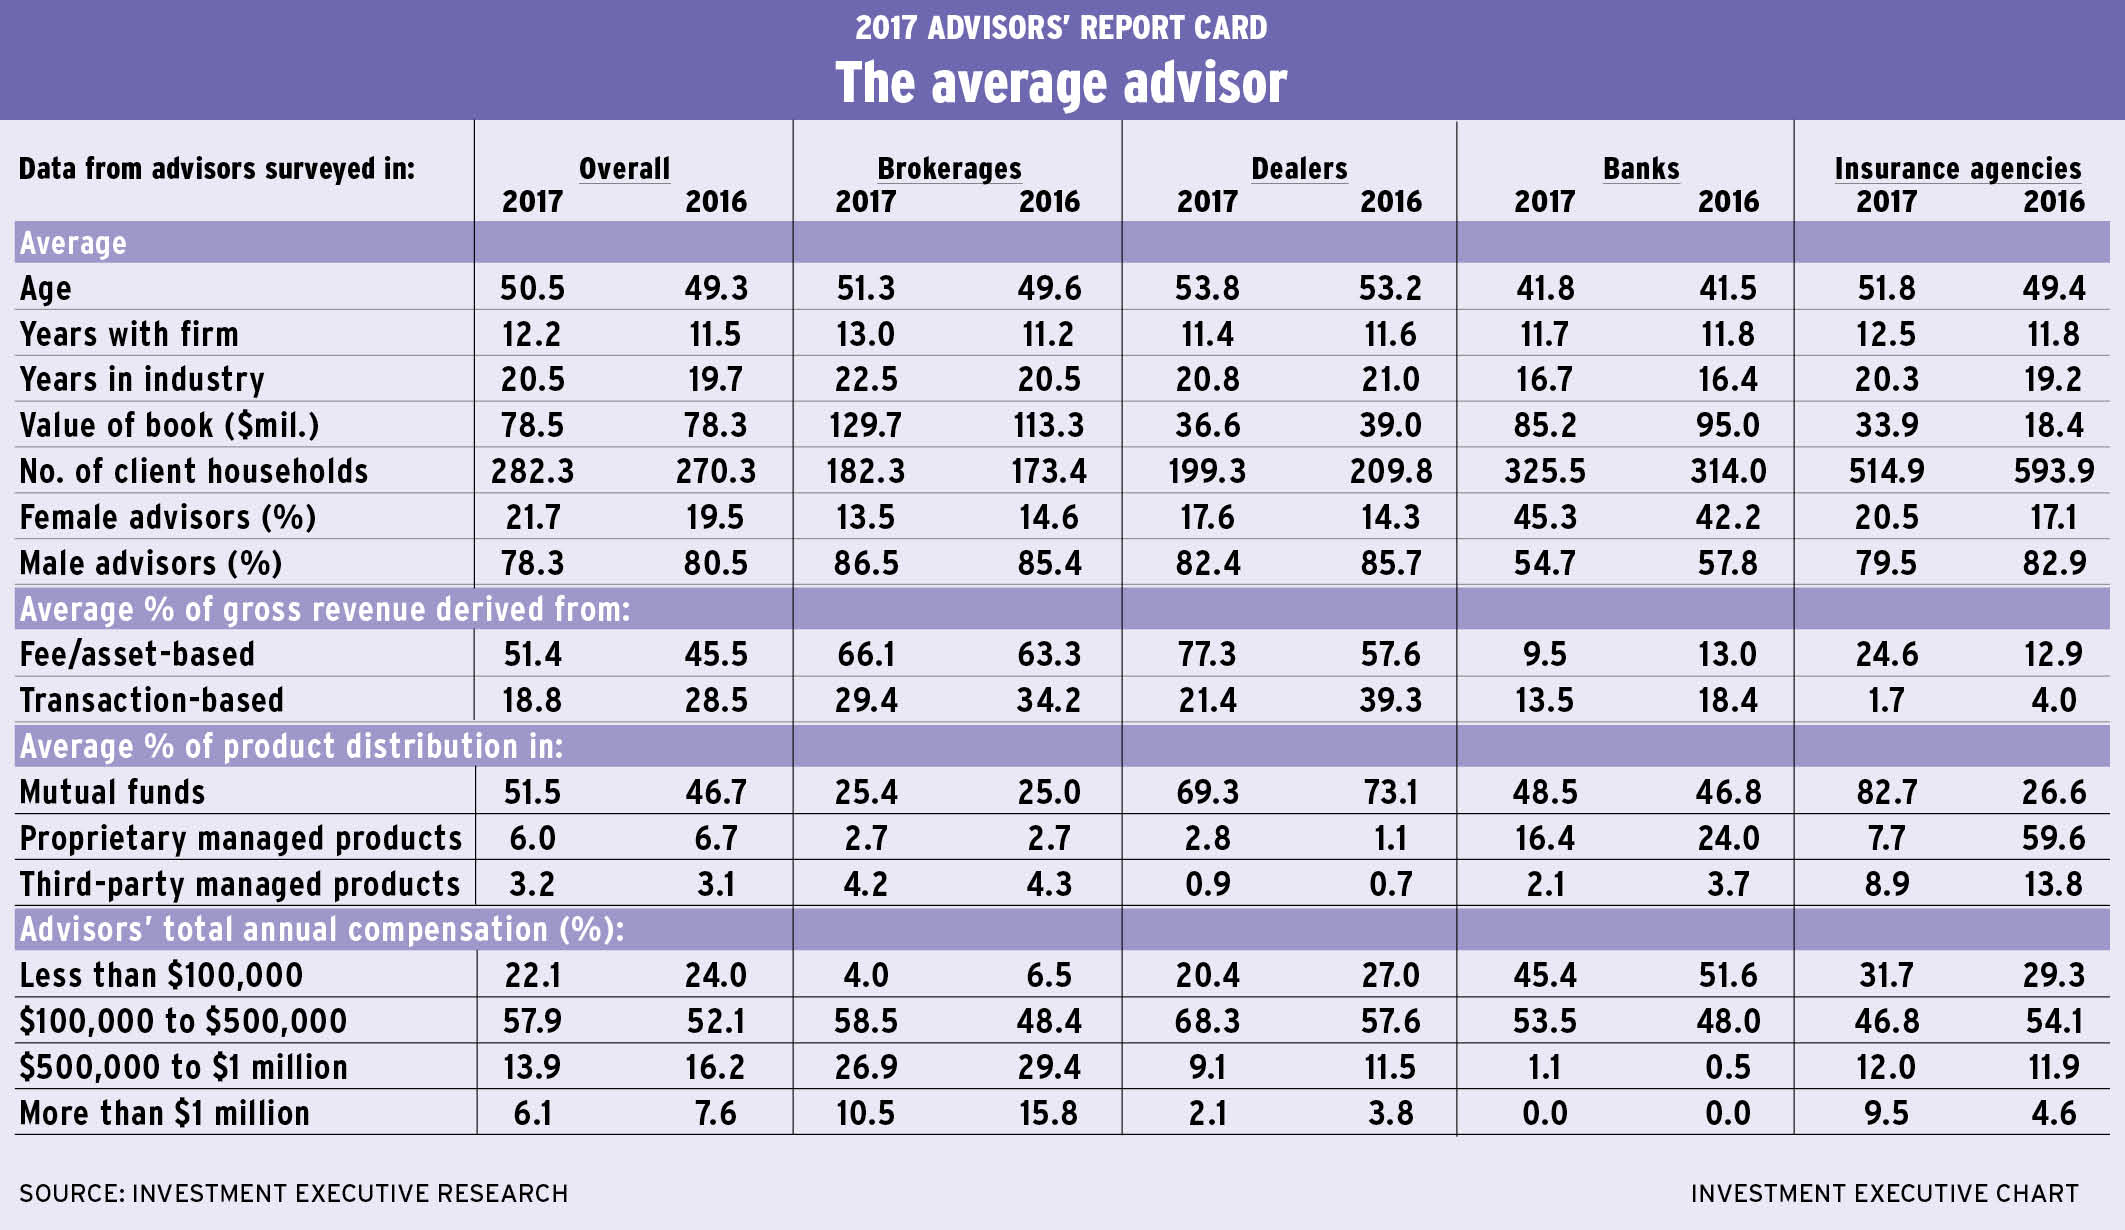
The fact the retail investment industry is thriving in the face of all of the negative headwinds may help explain some of the demographic trends that were revealed by this year’s data. In particular, the average advisor is slightly younger; the average age of survey participants dipped to 49.3 years old this year from 49.7 in 2015. However, the average tenure in both the industry and the advisor’s firm remained virtually unchanged.
This trend toward younger advisors was evident throughout the financial services sector, with the average age holding steady in each of the brokerage, mutual fund and full-service dealer, and bank-based channels of the advisor population. Given that the surveys take place a year apart, this stability in average ages overall suggests that these populations are not stagnant and that there’s some infusion of younger advisors to keep the reported average age stable year-over-year. At the same time, the insurance channel reported a notable drop in average age, putting the industry on par with the brokerage channel, leaving advisors in the dealer channel as the oldest group.
Bank-based advisors remain far and away the youngest segment of the advisor population, with an average age of just 41.5 years for this year’s Report Card series, but those advisors also recorded the biggest gains in AUM. Although the basic demographic characteristics of the bank-based advisors in Report Card on Banks remained constant year-over-year, average AUM rose to $95.0 million from $66.1 million in last year’s survey.
To some extent, this large jump in AUM reflects a methodological change in IE’s research for this segment. This year, IE’s survey of bankers was tightened up to focus on advisors with genuine investment businesses; in turn, bankers who are more devoted to the lending side of the business were excluded. These shifts in methodology should make IE’s surveys of the banking industry more comparable with the other front-line advisory forces that IE examines. However, these changes also render year-over-year comparisons in that channel in particular (and in the research overall) less reliable.
So, although average AUM for the entire advisory population that IE surveyed this year came in at $78.3 million, up from $66 million a year ago, not all of this represents organic growth. In fact, some of the increase reflects the change in the business profile of the bankers IE surveyed this year.
Indeed, the significance of bank-based advisors’ investment businesses may well have long been underestimated in IE’s surveys. So, even though the year-over-year comparisons are less informative, this year’s research also provides a truer picture of the actual competition that advisors with brokerages, dealers and insurance agencies face from their counterparts at the banks.
At the same time, the change in IE’s approach to the banking industry should generate a more accurate view of the distinction between the top 20% of advisors in the business (as measured by AUM/client household) and the remaining 80% that make up the rest of the industry.
According to this year’s surveys, the top 20% of advisors – regardless of the channel in which they ply their trade – have slightly more experience in the investment business, but vastly bigger books than their less productive counterparts. Case in point: the average top-performing advisor is about a year older, at 50 years old vs 49 years old for the remaining 80%; the average top performer has been in the investment business for almost 22 years vs slightly more than 19 years for the rest of the population.
Yet, the average top performer has more than three times the AUM of the average advisor in the remaining 80%. Advisors in the top 20% average $171.7 million in AUM vs $55.6 million for those in the remaining 80%. And AUM is spread across dramatically different client bases. The average top performer reports having slightly more than 130 client households on the books compared with almost 240 client households for the remaining 80% of advisors.
In terms of AUM/client household, then, the top performers hold an even more significant advantage over the remaining 80%. Although the average top performer has triple the AUM of the average advisor in the remaining 80%, the top performer outpaces the average advisor in the remaining 80% by almost six to one in productivity: average AUM/client household among top performers tops $1.5 million compared with slightly more than $260,000 for the remaining 80% of advisors.
Not surprising, this disparity in productivity also was reflected in the account distribution data for the two segments of the advisor population. For example, client accounts worth less than $250,000 make up more than half (52.6%) of the average advisor’s book for most of the sector; yet, among top performers, only about 13.3% of their client accounts fall into this category.
For top performers, more than a quarter (27.4%) of their client accounts are in the $500,000-$1 million range. And this segment of advisors reported that 43.3% of their client accounts are worth more than $1 million. Moreover, the proportion of the top performers’ books composed of these high-value client accounts is about evenly split between those that are worth $1 million-$2 million (21.5%) and client accounts worth more than $2 million (21.8%).
Conversely, for the remaining 80% of advisors, only 8.1% of their client accounts are worth more than $1 million; and, of these, just 2.4% are worth $2 million or more.
Turning back to the total population of advisors in all channels, a couple of other notable trends emerge. In terms of asset allocation, the overall proportion of the average advisor’s book devoted to mutual funds declined year-over-year to 46.7% from 54.1% in 2015. And while the popularity of third-party managed products also declined year-over-year, the use of in-house managed products increased.
The average advisor in this year’s surveys reported that 6.7% of his or her book is invested in proprietary managed products, up from 4.3% last year. Of course, the change in methodology in the banker research comes into play here: in that segment, the reported use of proprietary managed products jumped to 24% this year from 8.1% last year.
The other area in which the research shows a shift year-over-year was advisor compensation. In last year’s surveys, slightly more half (50.7%) of the advisors IE polled reported earning between $100,000 and $500,000 a year. This year, that percentage rose to 52.1%; and those who reported earning between $500,000 and $1 million also rose by about two percentage points to 16.2% from 14.1%.
These increases all came at the expense of the lowest income category. The proportion of advisors who reported that they’re earning less than $100,000 a year dropped to 24.0% from 27.3% in last year’s surveys. In contrast, the proportion of advisors who claimed to be earning $1 million or more annually was unchanged at 7.6% of the overall advisor population.
IE’s reappraisal of the banker population may be affecting the compensation numbers as well. But, apart from this noise in the data, the retail investment industry is enjoying growth despite all of the headwinds.
© 2016 Investment Executive. All rights reserved.