Given the significant changes taking place in Canada’s investment industry – from intensifying competition to the relentless march of regulatory reform – the impact of these forces is increasingly evident in the mutual fund dealer business.
The 2017 edition of Investment Executive‘s (IE’s) Dealers’ Report Card hints at a mutual fund dealer business that’s in a state of flux. The clearest sign of this is the fact that the average financial advisor’s assets under management (AUM) has declined at a time when markets have been surging.
Over the past 12 months, the S&P/TSX composite index has risen by about 11%, the S&P 500 composite index has gained by 15% and the major indices in Europe and Japan are up by even more. Over that same period, mutual fund business AUM also enjoyed double-digit growth rates. Yet, advisors who ply their trade at the traditional mutual fund dealers aren’t participating in these gains.
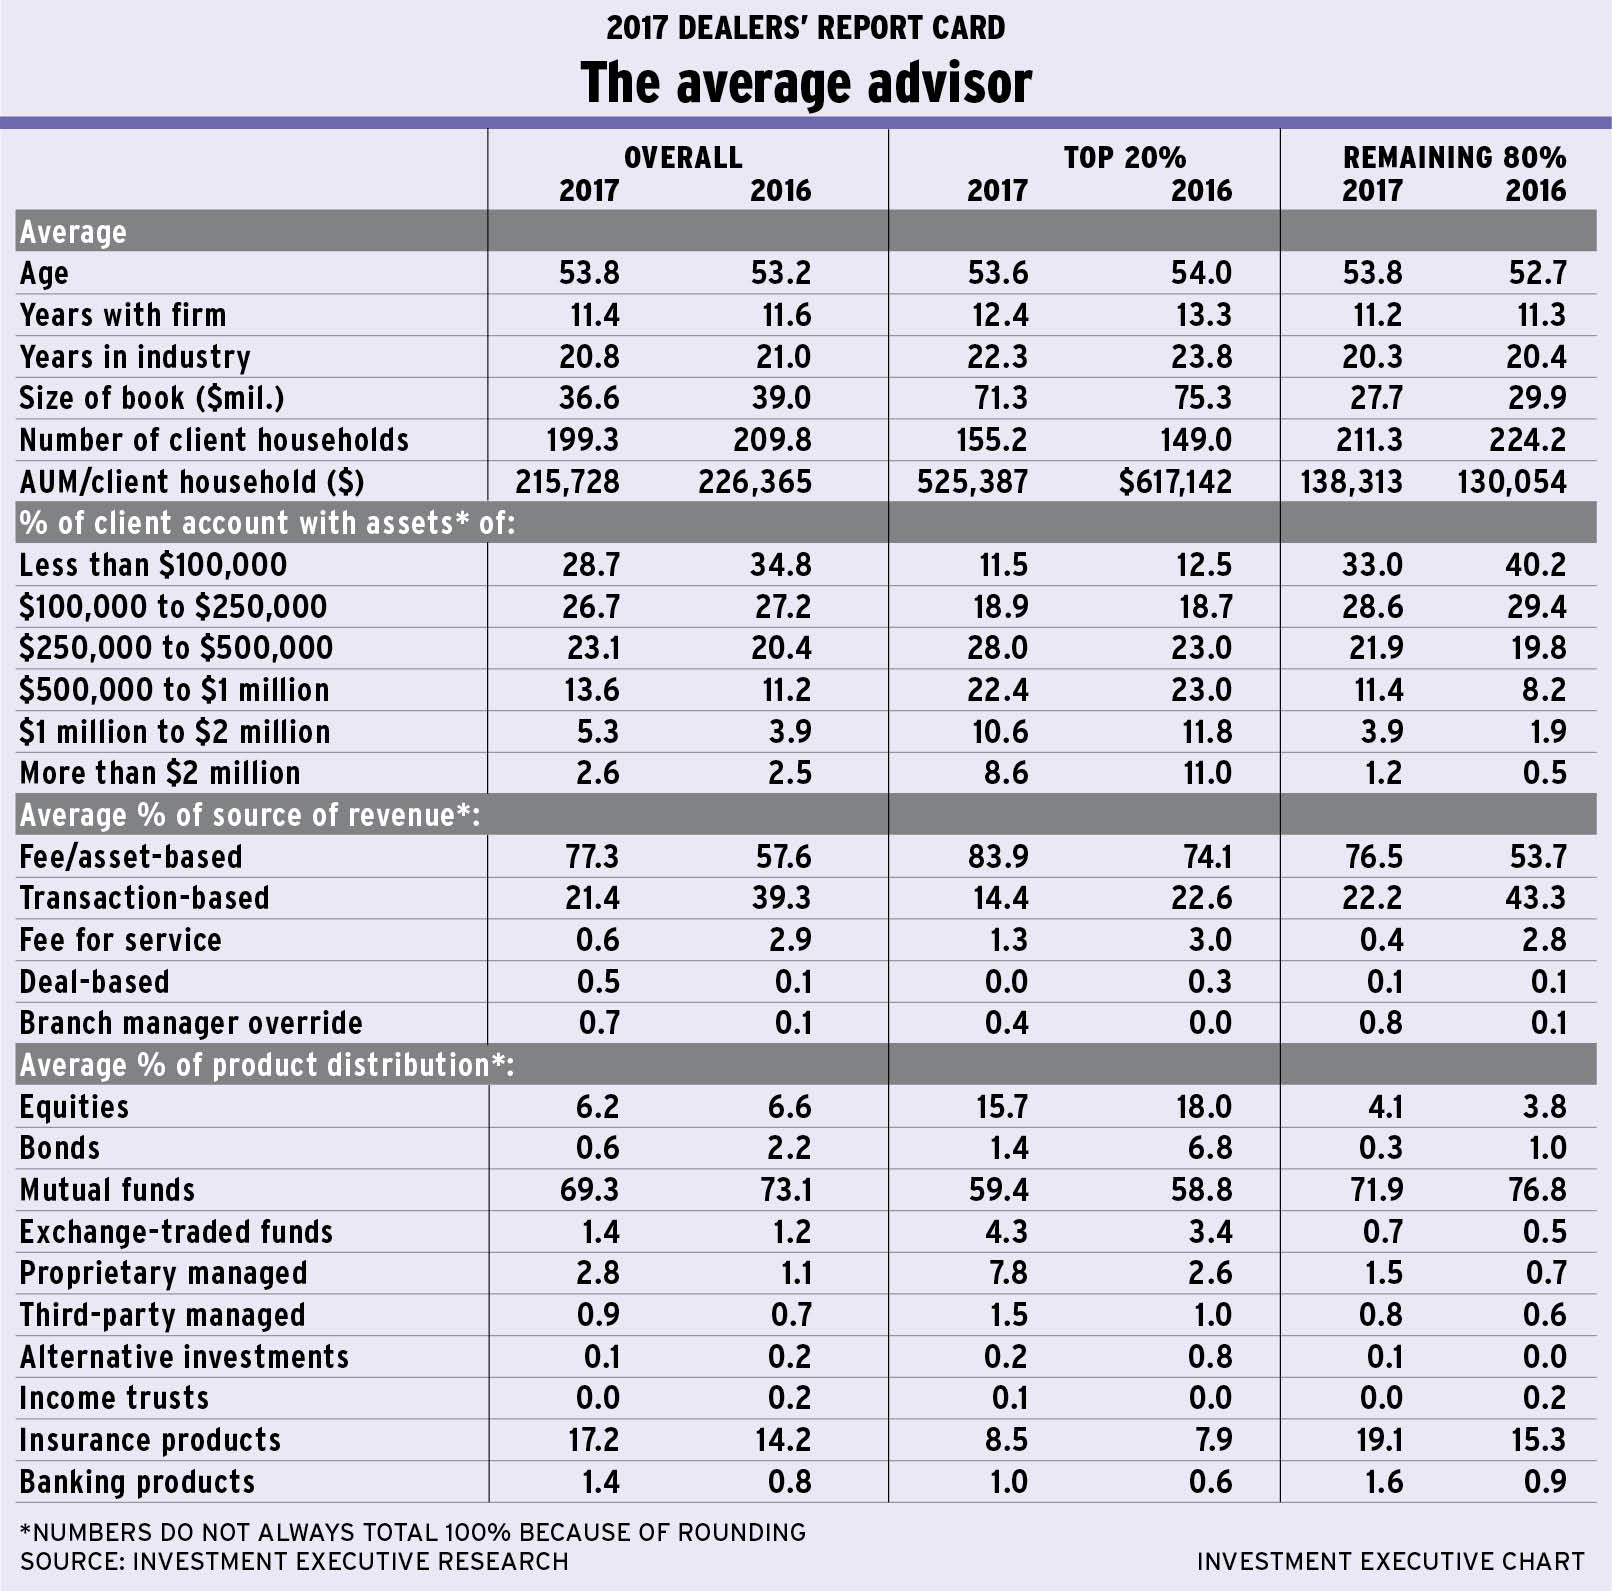
In fact, the average advisor’s AUM dropped to $36.6 million in this year’s Report Card from $39 million in 2016. The average number of client households that advisors serve also ticked downward, to 199.3 this year from 209.8 in 2016. Yet, the small dip in average client household numbers wasn’t enough to prevent a decline in advisors’ productivity (as measured by AUM/client household). Overall, average AUM/client household for the advisors surveyed dropped to $215,728 from $226,365 in last year’s survey.
The decline in advisors’ AUM is evident across the mutual fund business, afflicting both top performers (the top 20% of advisors as measured by AUM/client household) and the rest of the advisor population alike. On that basis, the data show that the top 20% of advisors’ average AUM dropped to $71.3 million this year from $75.3 million in 2016. For the remaining 80% of advisors, average AUM also dropped, to $27.7 million this year from $29.9 million in 2016.
Although average AUM was down for both segments of the advisor population, the trends in client numbers and average productivity for each segment are running in opposite directions.
For the top 20% of advisors, the average number of client households they’re serving climbed a little from last year, to 155.2 from 149. And rising client numbers combined with a decline in average AUM means productivity dropped to $525,387 from $617,142 year-over-year for this advisor segment.
Data reveal reasons for trends
Conversely, for the remaining 80% of advisors, client household numbers dropped year-over-year, to 211.3 from 224.2. Thus, average productivity held up quite well despite the dip in AUM. Indeed, for this segment of the advisor population, average AUM/client household rose a little – to $138,313 in 2017 from $130,054 last year.
The explanation for these trends is not entirely clear, but there are some hints in the data. Clearly, markets are not to blame for the decline in average AUM. Instead, shifts at both the client level and within the overall advisor population appear to be the drivers.
For example, looking at the mutual fund business overall, the headline decline in the average advisor’s AUM closely tracks the accompanying decline in client numbers. In aggregate, the mutual fund business appears to have simply lost some market share to other distribution channels within the investment business. (See the Brokerage Report Card in the May 2017 issue of IE, for example.) This state of affairs may reflect an increase in competition from emerging rivals, such as robo-advisors on the lower end of the market, whereas higher-end clients may be migrating to full-service brokerages that offer a broader range of services.
At the same time, there also were changes within the advisor population this past year. Notably, the average age of the top 20% of advisors ticked downward slightly, to 53.6 years from 54.0 years.
Although this decline is minor, keep in mind that if the population remained unchanged, the average age would be 55 years. So, even a modest decline in average age from the previous year suggests that the population is getting younger overall. Ultimately, these data suggest that some of the mutual fund business’s oldest reps are retiring or otherwise getting out of the business – and that not all of their AUM is being retained by their former firms.
However, unlike the top 20% of advisors, the remaining 80% of advisors are not getting younger. Rather, the average age for these advisors rose to 53.8 years from 52.7 years; this increase of one full year suggests that the basic demographic composition of this segment of the advisor population is largely unchanged year-over-year.
In fact, the decline in average age for the top performers, coupled with the expected aging of the rest of the advisor population, means that the top performers actually are younger than the rest of the mutual fund business now by a slight margin.
Yet, even as the top 20% of advisors are younger than the remaining 80%, the top performers still hold a two-year edge in industry experience over their lower-performing counterparts (22.3 years for the top performers vs 20.3 years for the rest) – which highlights the fact that top performers’ careers are both longer and more productive.
Alongside these demographic shifts in the advisor population, other data point to changes in the underlying economics of the mutual fund business. Competitive factors (including the rise of robo-advisors, growing demand for passive strategies and intensifying cost sensitivity), coupled with regulatory developments (such as the final implementation of the second phase of the client relationship model requirements and discussions about further reforms to industry conduct standards and compensation arrangements), surely are helping to drive a significant swing in advisors’ sources of revenue.
For example, the long-standing trend in revenue composition – toward more fee-based and asset-based sources of revenue and away from transactions – took a dramatic leap in this year’s Report Card. The average rep reported that he or she now derives 77.3% of his or her revenue from fee- or asset-based sources, up from 57.6% in last year’s survey. Most of the increase in fees is coming at the expense of transactions, which now account for just 21.4% of revenue, down from 39.3% last year.
This decisive shift toward fees was evident among both the top 20% of advisors and the remaining 80%. In fact, the top-performing reps generated 83.9% of their revenue from fee- or asset-based revenue arrangements, up from 74.1% the year before, while transactions accounted for 14.4% of their revenue compared with 22.6% in last year’s Report Card.
The move is just as dramatic among the rest of the advisor population, as fees now account for 76.5% of their revenue, up from 53.7% in 2016. In tandem, transaction-driven revenue for this advisor segment was slashed to just 22.2% this year from 43.3% a year ago.
Although the trend toward fees and away from transactions has been underway for some time, it really took off over the past year.
Mutual funds’ prevalence dips
In addition to changes in advisors’ revenue, their asset allocation underwent some changes as well. Overall, the prevalence of mutual funds declined a bit, dipping to 69.3% of the average book in this year’s survey from 73.1% in the 2016 Report Card. At the same time, the average advisor reported that insurance products now comprise a bigger share of his or her AUM, rising to 17.2% this year from 14.2% last year.
This spike in the use of insurance products does not appear to represent some form of regulatory arbitrage, in which advisors shifted away from more heavily regulated mutual funds in favour of segregated funds. In fact, the data indicate that the overall market share for seg funds changed little year-over-year.
Within the insurance category, living benefits products enjoyed the greatest increase in share of revenue.
The other notable change in asset allocation from last year’s Report Card is advisors’ use of proprietary managed products, which also surged to 2.8% of the average book from just 1.1% in last year’s Report Card. Although both the top performers and the rest of the advisor population are using more of these products, that trend is particularly evident among the industry’s top performers: the share of the top 20% of advisors’ average AUM that’s devoted to proprietary managed products tripled to 7.8% this year from just 2.6% in 2016. These reps also use more ETFs: the share of AUM for these products rose to 4.3% from 3.4% year-over-year.
For the top performers among the advisor population, increased allocations to proprietary managed products and ETFs came primarily at the expense of direct securities – namely, equities and bonds – as the allocations for these products dropped notably year-over-year while the use of mutual funds actually ticked upward a bit this year.
For the remaining 80% of advisors, ETFs and most other investment products remain relatively tiny components of the average book. Mutual funds continue to reign supreme, with a 71.9% share of AUM, although this is down from 76.8% last year. Conversely, these advisors’ use of insurance products surged to 19.1% of the average book this year from 15.3% year-over-year.
Proprietary managed products also captured a notably larger share of the average book for these lower-performing reps. Although these products still represent just 1.5% of AUM, this percentage is more than double the 0.7% share these products held last year.
© 2017 Investment Executive. All rights reserved.